
Are higher mortgage rates finally impacting demand?
There are still anecdotes about multiple offer scenarios in much of the country, and inventory is still super tight. But, there has been a slight slowdown in the sales rate and a few more price cuts across the country. It appears that the impact of 7% mortgage rates is very subtly showing up in the data now.
Mortgage rates have been stubbornly high — around 7% — for a month. There was already an affordability challenge compared to 18 months ago, so every move higher with mortgage rates eliminates some demand from buyers. Buyers all year have been surprisingly resilient compared to the fall of 2022, so what we’re looking for is where that affordability threshold starts to turn the market down again.
Inventory
There are now 451,000 single-family homes available on the market across the U.S. That’s up 1.8% from last week. Supply of homes for sale remains incredibly restricted. 2023 began with 70% more homes on the market than a year earlier. There are now just 7.7% more homes on the market. This gap has been narrowing all year. If mortgage rates spike, home buyer demand seems very sensitive and poised to slow again. We could lose momentum very quickly. In September 2022, rates spiked to 7.5% and at that time the data showed a very unusual inventory jump and price decline late in the year. So, keep your eyes out for that. If rates fall from here, expect resumed bidding wars for the end of the summer and declining inventory even further.
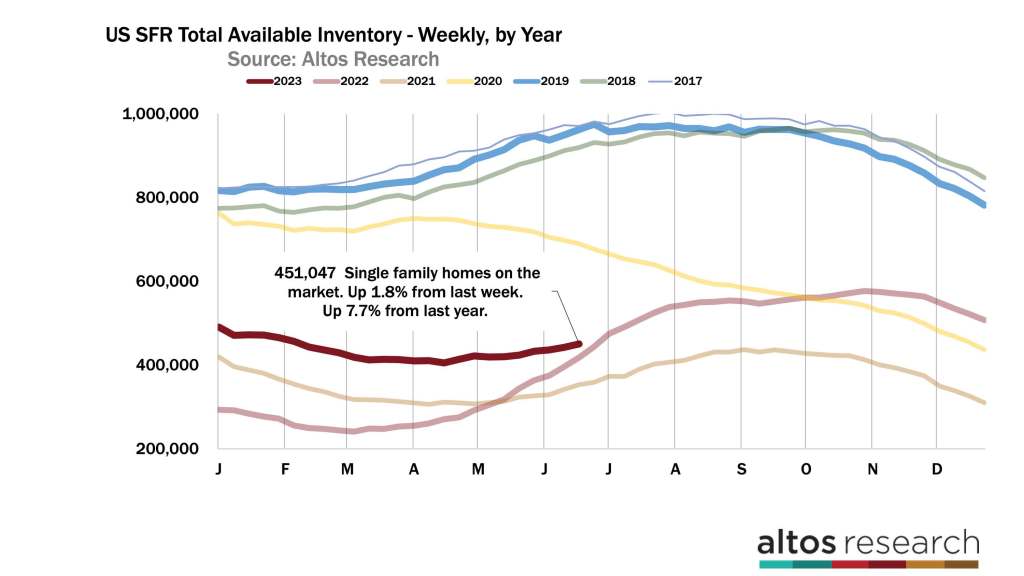
As of right now, we are expecting to finish 2023 with 10% fewer homes on the market than where the year started. We’ll see how that projection changes in the second half of the year if these trends hold or if new macro forces take over.
Always look for weaknesses in demand to show up in the price reduction data. After a month of 7% mortgage rates, the data is showing the first inklings of that weakness this week. Price cuts have been very slow to rise this year as we’ve had more demand than supply of homes. And while in 2022 at this time, you could see dramatic cooling in the market, this year is much more subtle.
31.4% of the homes on the market have taken a price reduction. That’s up 70 basis points from last week. 2022’s weekly change was 170 basis points. In previous years we might see 50 basis points change in the middle of June. So this week’s change means slightly more price cuts than in recent weeks and also slightly more than many of the pre-pandemic years. Though price cuts are rising much more slowly than last year at this time.
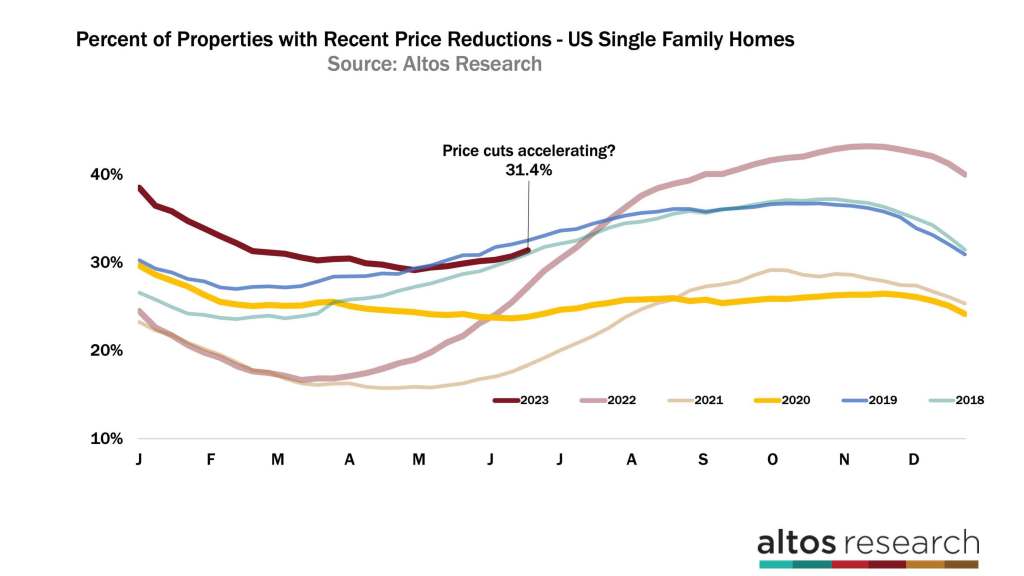
In the chart above, the dark red line is the curve of price cuts for this year. Examine all the homes on the market, how many have taken a price cut? The steepness of this line is how quickly the market is changing. The light red line represents 2022 data and it was rising super steeply. From that slope, we could tell that demand had stopped, and that home sales prices would be declining in the future months. That’s not true today, though as I said, maybe these are the first signs of a changing market.
Price
Home prices are at their peak for the year at $455,000 for the median price of single-family homes. That’s basically unchanged from last week and about 1% below where it was in 2022 at this time. Ultimately if home prices finish 2023 unchanged from 2022, that is about as positive as could be imagined coming into the new year. The prices shown in the chart below are the median for all the single-family homes on the market. This leads the future sales prices because these are homes that are on the market now and will sell in the future.
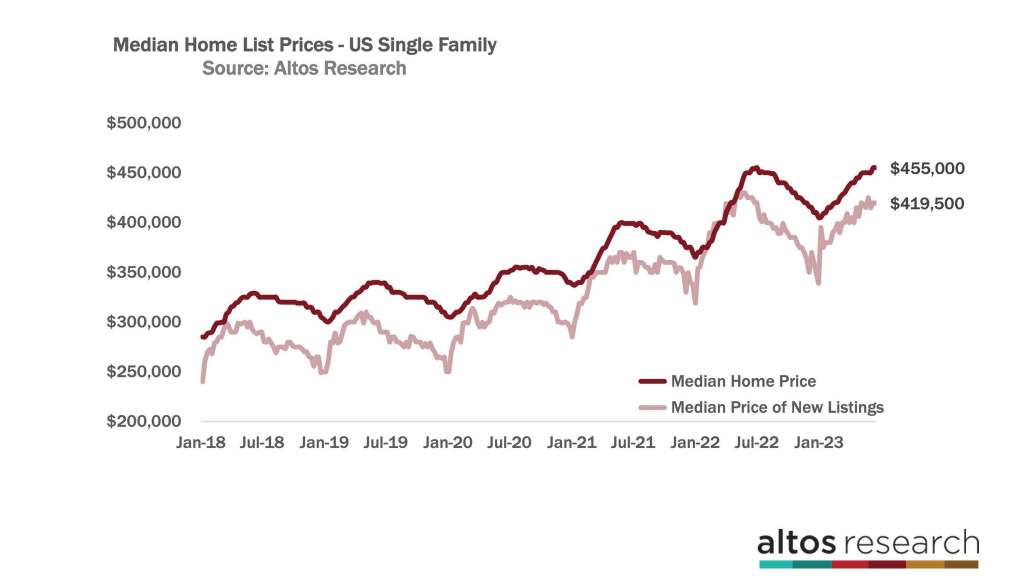
The median price of the new listings is $419,500. That’s the light-colored line the chart. I’ll be watching this leading indicator to see if by July it isn’t back above the 2022 level. In July last year, home prices took their first big step down. July is always the seasonal down step for the new listing prices so we’ll see how steep the change is this July. Do homebuyers keep up their momentum from the first half of the year or do they stop as quickly as last year?
Meanwhile, the price of the homes in contract is now $385,000 — up over 1% for the week and unchanged from 2022. The price of the homes in contract was falling by this time last year and it’s still rising now, this is the result of the momentum of market demand from the spring and is a signal of price support for sales that will complete in July and August.
When examining the total rate of those new sales though, it’s dropping. We’ve passed the annual peak of sales volume and this is one of those places we can see the impact of higher mortgage rates. There are now 386,000 single-family homes in contract with only 65,000 new pending sales this week. The new sales rate is 21% fewer than last year at this time. That’s going the wrong way. I’ve been optimistic that the gap would close with the sales rate from 2022 by the third quarter, but now thanks to the 7% mortgage rates, that looks like it’s not going to happen. Sales rates are slow enough that transaction volume isn’t accelerating anymore.
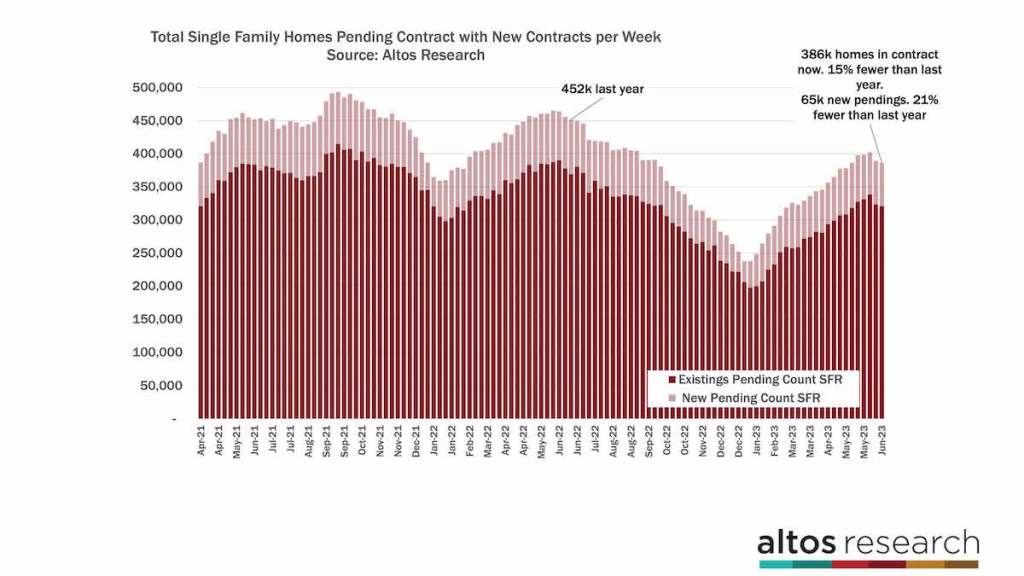
In this chart, each bar represents the total number of homes in contract on any given week. The light portion of the bar is those newly in contract. At the far right end of the chart, you can see how that sales rate is declining. This change is a signal of the impact of those mortgage rates.
If you follow these videos, you’ll know I talk about immediate sales — those homes that get offers within hours or just a couple of days after listing. In the 4 weeks since mortgage rates spiked, the percentage of new listings that go immediately into contract has ticked down every week. This change is an indication that buyers are slightly less eager to snap up the homes as they get listed.
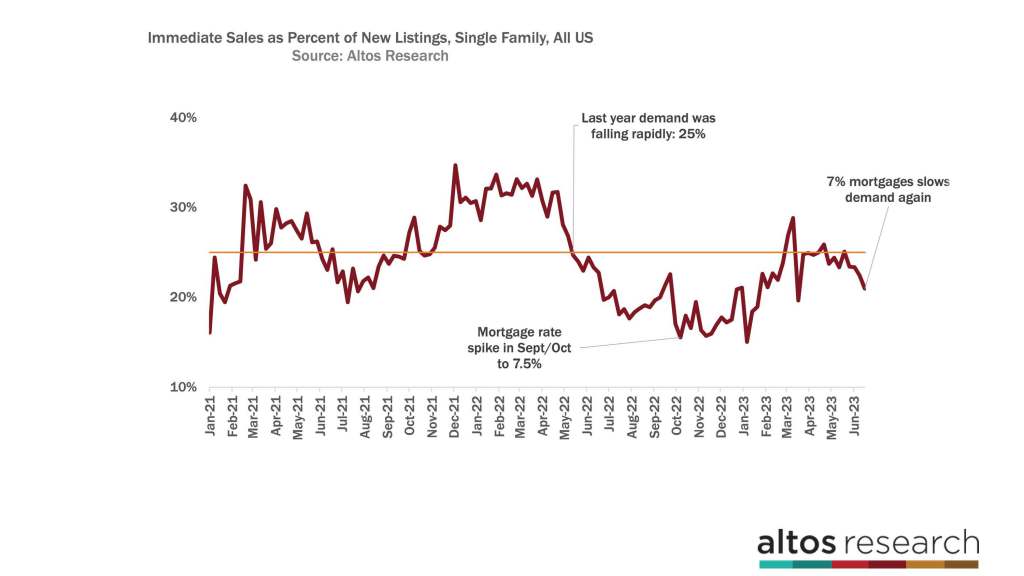
This chart is that percentage over time. I’ve highlighted the point in 2022 when demand was freezing up, and you can see the immediate sales percentage was plummeting. I’ve also pointed out where — last September — the immediate sales rate hit a low point exactly when rates spiked the highest. The likelihood that your listing would get same-day offers climbed this spring, but like clockwork, those offers have slowed. On the far right side of the chart, we can see four weeks in a row of a declining rate of immediate sales. Each week a few more people decide not to bid on that house, preferring to wait to see if money gets cheaper first.
Most sellers don’t notice these trends yet. The best homes at the right prices still have buyers, but the pieces are starting to come together. Each week fewer people make those bidding wars and fewer homes go into contract. Those that didn’t get their offers a few more of them do a price reduction. That means slightly less price support for sales prices in the future. These are subtle changes in demand but they’re worth watching as we try to understand whether this year’s minor resurgence in the housing market has legs or whether it will wither at the slightest jump in the cost of money.
Never a dull moment in the real estate market. The basic fact remains true: home buyers and sellers need to know what’s happening. They have a lot of opinions and a lot of noise to filter. They need you to get them the actual data as soon as it becomes available.
More next week.
Mike Simonsen is the founder and president of Altos Research.